

TL;DR
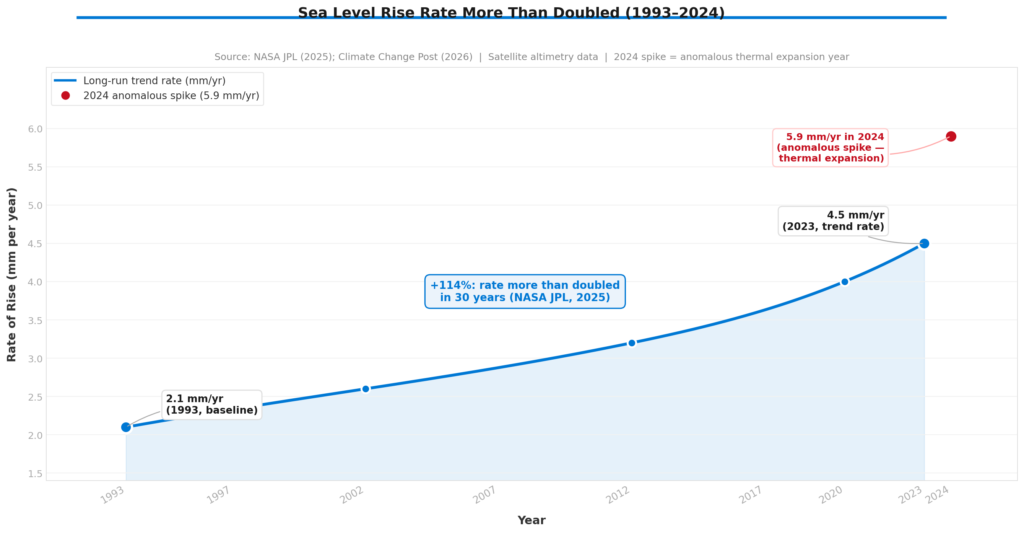
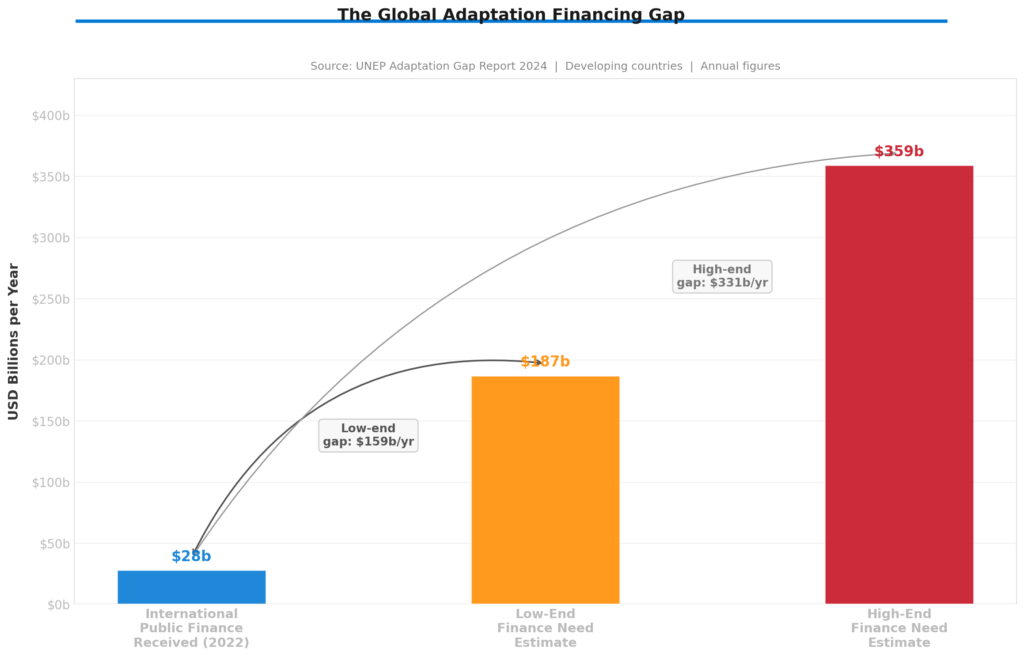
Sea level rise has crossed from climate science into capital allocation. The long-run trend rate more than doubled from 2.1 mm per year in 1993 to 4.5 mm per year in 2023, and a thermal-expansion anomaly in 2024 pushed the annual reading to 5.9 mm, well above the expected 4.3 mm (NASA JPL, 2025). A peer-reviewed study published in Environmental Research Letters confirmed that Central Asia lost around 30 km3 of glacier ice in 2025, roughly 2% of the region’s remaining volume in a single year (Van Tricht et al., 2026). International public adaptation finance to developing countries reached only $28 billion in 2022, against a verified annual need of $187 to $359 billion (UNEP, 2024). This report introduces the Coastal Defensibility Index (CDI), a conceptual framework that reframes how boards and investors should screen coastal assets: not by exposure alone, but by how well adaptation capacity covers that exposure. In a world of fragmented repricing, that ratio increasingly determines which assets hold value and which do not.
Sea Level Rise Has Moved From Climate Variable to Capital Allocation Signal
Sea level rise once lived inside science reports and long-range infrastructure plans. Credit committees, insurance desks, and corporate boards rarely saw it. That separation has ended, and I think the speed of the shift will surprise even those who tracked the physical data closely.
Since 1993, global mean sea level has risen approximately 10 cm in total, with the long-run trend rate climbing from 2.1 mm per year to 4.5 mm per year by 2023 (NASA JPL, 2025). The rate more than doubled in three decades. That trajectory matters because financial models, infrastructure plans, and urban zoning systems mostly assume smooth, predictable change. Sea level rise now compounds.
In 2024, the annual reading spiked to 5.9 mm per year, well above the expected 4.3 mm. Two-thirds of that year’s rise came from thermal expansion of warming oceans rather than meltwater, a ratio NASA described as unexpected (NASA JPL, 2025). The spike does not mark a new trend rate. It illustrates how individual years can now produce readings sharp enough to trigger financial responses before the long-run trajectory reaches its next inflection point.
Markets do not wait for permanent inundation. Coastal property facing a credible future flood discount becomes harder to refinance. Municipalities with rising flood exposure pay more to service their debt. Insurers exit before loss ratios peak. The mechanism is the same across all three: markets price expected future cash flows, and sea level rise now changes what those flows look like across a growing number of geographies.
Three Physical Engines Are Now Running Simultaneously
Sea level rise draws power from three reinforcing processes: thermal expansion as oceans absorb heat, glacier retreat, and ice sheet discharge. In 2024 and 2025, all three ran simultaneously, and one of them broke every record in the measurement history.
An international research team led by Lander Van Tricht at Vrije Universiteit Brussel and ETH Zurich confirmed in Environmental Research Letters that Central Asia lost around 30 km3 of glacier ice in 2025, equivalent to nearly 2% of the region’s remaining glacier volume (Van Tricht et al., 2026). The loss equals roughly 30% of all glacier ice still present in the European Alps today. Nine of the 16 monitored glaciers recorded their worst mass balance since measurements began, and 64% of all glaciers across the region posted their worst year since 1991. Glaciers in the western Pamir and western Tien Shan lost between 2% and 4% of total ice volume in a single melt season, driven by warm spring temperatures, reduced snowfall, and accelerated melt through the snow-ice albedo feedback.
The 2025 global sea level reading fell back from the 2024 spike because La Niña temporarily stored more water over land. NASA confirmed that short-term variation of this kind does not alter the long-run acceleration (NASA, 2026). For asset owners, the relevant signal is the trend, not any single annual reading.
Florida Showed How Climate Exposure Converts Into Fiscal Stress
Florida’s property insurance market provides the most documented case study of how physical climate exposure moves through a financial system. The sequence from 2022 to 2024 shows how quickly private capacity withdraws, what a state backstop costs, and how long recovery takes. It is evidence for a global mechanism, not a uniquely American story.
After Hurricane Ian in late 2022, multiple Florida domestic insurers became insolvent or exited the market. Citizens Property Insurance Corporation absorbed the overflow, swelling to nearly 1.5 million policies, and posted a net loss of $2.2 billion that year (Florida OIR, 2024). That loss fell not on shareholders but on the state’s fiscal capacity and on all policyholders through mandatory assessments. By April 2024, Florida OIR confirmed that eight new insurers had entered the market, 13 companies had assumed more than 354,000 Citizens policies, and Citizens posted net income of $746 million in 2023 (Florida OIR, 2024). Stabilisation came, but at the cost of significant premium inflation, concentrated state risk exposure, and structurally reduced private capacity in the most exposed coastal zones.
Sea level rise did not cause Hurricane Ian. It raises the baseline water level against which every storm surge and every drainage system now operates. The same mechanism runs at earlier stages across South Asia, West Africa, and Southeast Asia today.
When Sea Level Rise Becomes a Sovereign Credit Event
Most climate-finance commentary focuses on property, insurance, and corporate assets. The sovereign debt dimension deserves equal attention, because it is where sea level rise stops being a sector-specific risk and becomes a systemic one.
Consider the Maldives. The country carries a sovereign credit rating that reflects, among other inputs, a tourism-dependent economy built almost entirely on infrastructure sitting at an average elevation of 1.5 metres above sea level. NASA JPL projects at least 15 cm of sea level rise for the Indian Ocean over the next 30 years regardless of near-term emissions changes (NASA JPL, 2024). A 15 cm rise on a 1.5 metre island does not simply flood infrastructure. It renders the long-term viability of the tax base structurally uncertain. Bond buyers who price that uncertainty today accept lower yields. Bond buyers who discover it later absorb losses.
Bangladesh tells a related but different story. More than 30 million people live within three metres of mean sea level along the Bay of Bengal coastline. The country has invested heavily in cyclone shelters and embankments, but the financing capacity to sustain that investment across the full exposure footprint does not exist domestically. A 2025 study found that countries with higher physical climate risk scores receive lower sovereign ratings, with the effect strongest in developing countries with narrow fiscal space (ScienceDirect, 2025). Bangladesh is not yet a case study in sovereign default. It is a case study in how adaptation financing gaps compound sovereign credit risk over time.
Pacific Island states face the most concentrated version of this dynamic. Kiribati, Tuvalu, and the Marshall Islands each carry sovereign exposure that no engineering solution fully resolves at current sea level rise trajectories. What makes this analytically important is the contagion pathway: when one Pacific Island state requires debt restructuring linked to climate displacement, it sets a precedent for how rating agencies, multilateral lenders, and bilateral creditors frame the next case.
The deeper pattern is this: sea level rise does not need to destroy infrastructure to damage a sovereign’s creditworthiness. It only needs to make the long-run cost of defending that infrastructure exceed the fiscal capacity of the state responsible for defending it.
Sea Level Rise Now Sits Inside the Cost of Capital
Insurance markets move first on physical climate risk. Credit markets follow as loss histories accumulate and disclosure tightens. Both transitions now run in parallel, and the evidence base has strengthened significantly in the past two years.
Research published in the Review of Financial Studies found that municipal bond yields in areas with greater sea level rise exposure run higher, even after controlling for standard credit variables (Review of Financial Studies, 2023). An Irish study found that borrowers in flood-risk areas pay 7 to 13 basis points more on commercial loans, confirming that climate-sensitive geography now enters lending pricing directly (Economic and Social Review, 2025). ADB estimates that $864 billion of assets in 23 major East Asian cities sit within the footprint of a 1-in-100-year coastal flood event, and that sea level rise will increase regional coastal flood losses by at least 12-fold by 2100 (ADB, n.d.). International public adaptation finance reached $28 billion in 2022, against an annual need of $187 to $359 billion (UNEP, 2024).
To translate that gap into board-level terms, consider a simplified illustration. A logistics facility valued at $500 million in a coastal zone where insurance-adjusted financing costs rise by 100 basis points faces an enterprise value reduction of roughly $30 to $50 million under standard DCF assumptions, depending on the asset’s weighted average cost of capital and terminal growth rate. That loss does not require flooding. It requires only that the market prices a higher carrying cost into the discount rate. For a portfolio of coastal industrial assets, that repricing can move total value by hundreds of millions before a single facility takes on water.
Introducing the Coastal Defensibility Index: A Conceptual Framework for Capital Triage
The Original Analytical Contribution of This Report
Most risk frameworks treat sea level rise as a single-axis problem. They rank assets by flood exposure and stop there. That approach systematically misprices both risk and opportunity, because it ignores the variable that determines whether exposure becomes loss: adaptation capacity.
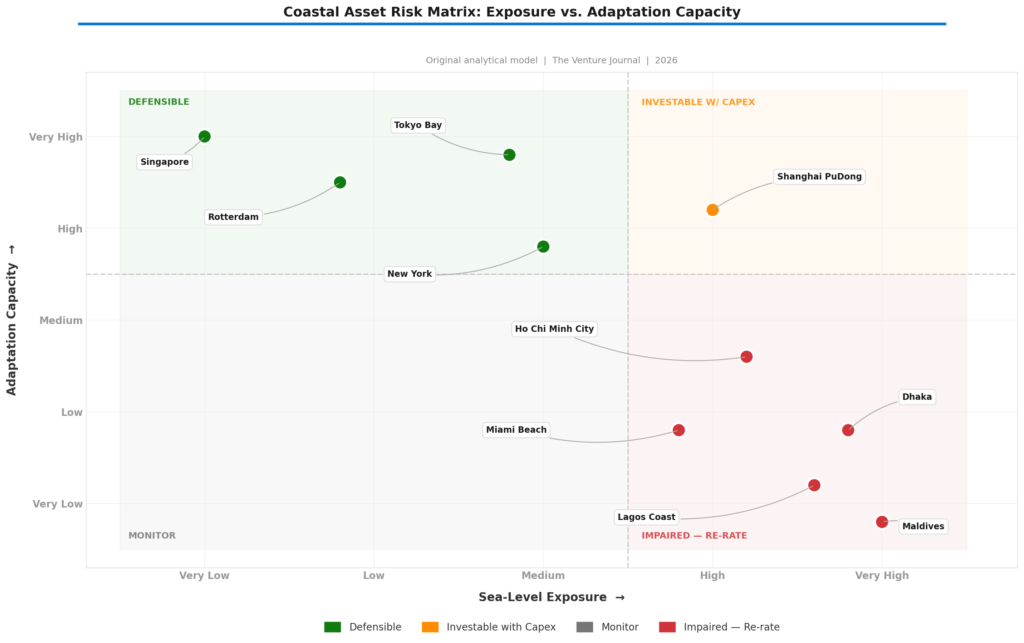
The Coastal Defensibility Index (CDI) is a conceptual framework, not a precise quantitative index. It captures a directional relationship: the higher the adaptation capacity relative to physical exposure, the more defensible the asset’s position. Think of it as a ratio in structure but a judgement in practice. CDI rises when a city invests seriously in flood defences, strengthens governance, maintains insurer access, and builds fiscal capacity to sustain protection over time. CDI falls when any of those conditions deteriorates, regardless of whether the physical exposure changes. The framework does not produce a single auditable number. It produces a structured way of asking the right question: does this location’s capacity to manage sea level rise keep pace with the risk it faces?
CDI as a concept: Adaptation Capacity relative to Sea-Level Exposure. A high CDI signals that a location credibly contains the consequences of its exposure over the investment horizon. A low CDI signals that exposure is outpacing the defence capacity behind it. The scoring in the matrix below reflects qualitative analytical judgement, not a formula.
Adaptation Arbitrage: The Contrarian Investment Case
The conventional approach to climate-risk investing is defensive: screen out high-exposure assets, concentrate capital in low-exposure geographies, and wait. That logic is sound for the bottom-right quadrant of the CDI matrix. But it misses the most interesting part of the opportunity set, which is not where exposure is lowest, but where defensibility is improving fastest relative to current market pricing.
Call it adaptation arbitrage. Every time a city moves from low CDI to high CDI, asset values re-rate upward. The market price of an asset in a high-exposure city with a credible, funded, and improving flood defence programme should converge toward the price of an equivalent asset in a naturally low-exposure city. When it has not yet done so, the gap between current market pricing and forward defensibility represents a genuine investment opportunity. Investors who identify cities on the upward CDI transition curve and enter before institutional capital reprices the geography have historically earned the premium. The Delta Works in the Netherlands turned Rotterdam’s waterfront from a liability into one of the most valuable port footprints in Europe over a period of decades. Investors who backed Rotterdam industrial property during the Delta Works construction did not require low exposure. They required confidence in the trajectory of defensibility.
The same logic applies in reverse. A city with apparently stable current exposure but quietly deteriorating CDI, falling insurance market participation, deferred maintenance on levees or sea walls, or weakening municipal fiscal capacity, represents a selling opportunity before the market recognises the shift. The CDI framework is as useful for identifying exits as it is for identifying entries.
The matrix below applies the CDI framework across ten major coastal zones. The scoring draws on NASA JPL sea level projections, IPCC coastal risk assessments, Notre Dame Global Adaptation Index country scores, ADB resilience ratings, and published flood defence investment records.
Methodology note: The CDI matrix uses a 1-to-5 ordinal scale on both axes, reflecting qualitative analytical judgement rather than a derived quantitative formula. Sea-level exposure draws on NASA JPL projections, elevation data, and IPCC coastal risk assessments. Adaptation capacity draws on ND-GAIN country scores, ADB resilience ratings, and published flood defence investment records. The quadrant boundary sits at 3.5 on both axes, representing the midpoint of the scale. Scores carry the uncertainties inherent in qualitative cross-country comparison. Treat this matrix as a structured starting framework for due diligence, not a substitute for site-specific risk modelling.
What the Bears Get Right: Three Reasons for Disciplined Caution
The case for caution on sea level rise as a near-term financial driver rests on three reasonable points. First, annual data carries real noise. The 2024 spike to 5.9 mm per year came from an anomalous thermal event, not a permanent shift in trajectory (NASA JPL, 2025). La Niña then pulled the 2025 reading back. Boards that chase single-year readings into capital allocation decisions will generate as many errors as insights.
Second, adaptation works when governments fund it seriously. The CDI framework captures this precisely: high exposure combined with genuinely improving adaptation capacity is not a risk story. It is an investment story. The bear case does not disprove the CDI thesis. It reinforces it. The question is never just “how much sea level rise?” but always “how much adaptation capacity exists to meet it?”
Third, the strongest version of the bear case is not that sea level rise overstates the problem. It is that the transition will create enough unevenness and delay that blunt capital allocation overreacts to macro signals while missing the specific assets that face genuine near-term impairment. Selective, CDI-informed triage generates better outcomes than either denial or panic.
Three Scenarios and What Each One Demands from Capital Allocation
Sea level rise will not resolve into a single outcome over the next decade. The three scenarios below reflect the plausible distribution of paths based on current policy trajectories, adaptation investment levels, and climate science. The probability weights draw on IPCC scenario literature and UNEP adaptation gap data rather than precise statistical modelling. They represent structured analytical judgement, and their purpose is to identify which capital allocation decisions hold value across all three paths, not to predict which path materialises.
- Managed adaptation, 25% probability. Governments in major exposed cities accelerate defence investment. CDI scores rise systematically across the top-right quadrant. Insurers maintain broad market coverage at higher premiums. Investors who entered high-exposure, improving-CDI assets early outperform significantly as the market reprices the defensibility transition.
- Fragmented repricing, 50% probability. CDI scores rise in well-governed cities and fall quietly in poorly governed ones. Insurance capacity stays selective and geographically uneven. Municipal credit spreads widen in lagging areas. This is the base case, and it rewards exactly the precision the CDI framework provides. Adaptation arbitrage opportunities concentrate here.
- Disorderly retreat, 25% probability. Repeated flood events, insurance withdrawal, and fiscal pressure overwhelm local adaptation across multiple major cities simultaneously. Low-CDI assets face structural write-downs. Sovereign credit stress in Pacific Island states and low-lying emerging markets accelerates faster than current pricing implies.
Five Decisions That Belong on Every Board Agenda Now
The CDI framework converts sea level rise from a background risk into a screening criterion. These five decisions apply to any organisation with material coastal exposure in its asset base, supply chain, or operating footprint, and they hold across all three scenarios above.
- Screen every coastal asset through the CDI lens. Exposure alone does not determine risk. How well adaptation capacity covers that exposure does. Assets with falling CDI scores warrant re-underwriting, hedging, or capex-conditioned hold strategies regardless of their current flood probability.
- Reclassify resilience capex as value protection, not ESG overhead. Any investment that raises a CDI score preserves asset liquidity, insurance continuity, and financing access. That belongs in capital project pipelines.
- Hunt adaptation arbitrage explicitly. The best risk-adjusted opportunities in coastal infrastructure sit where CDI scores are improving faster than market valuations reflect. Identify those transitions early, before institutional capital reprices the geography.
- Stress-test supply chains for CDI exposure. Sea level rise typically reaches a business through its logistics network before it reaches owned assets. A distribution hub with a falling CDI score is a supply-chain vulnerability, not merely an infrastructure concern.
- Add CDI logic to sovereign and municipal risk screens. The combination of low elevation, limited fiscal space, and deteriorating adaptation governance represents a credit risk pathway that standard rating metrics capture late.
Geography has always shaped where wealth concentrates. Trade routes, harbour access, fertile coastlines, proximity to markets: location has been the foundation of economic advantage for five thousand years. Sea level rise does not end that relationship. It reprices it.
The assets that hold value through this transition will not necessarily be the ones with the lowest exposure. They will be the ones where adaptation capacity credibly covers physical risk across the relevant investment horizon. The distinction between exposure and defensibility is already visible in insurance premiums, municipal bond spreads, and property valuations in the most exposed markets. It will become visible everywhere else in the years ahead.
Sea level rise still arrives in millimetres. Markets are beginning to respond in billions. The boards that understand the difference between exposure and defensibility will be the ones who know which direction those billions flow.
References
- Asian Development Bank (n.d.) Economic Costs of Rising Sea Levels in Asia and the Pacific. Manila: ADB. Available at: https://www.adb.org/features/economic-costs-rising-sea-levels-asia-and-pacific [Accessed 1 June 2026]. [$864 billion refers to assets exposed to a 1-in-100-year coastal flood event across 23 East Asian cities; 12-fold increase in regional coastal flood losses by 2100 based on ADB climate modelling.]
- Economic and Social Review (2025) Firm Credit Conditions and Flood Risk: Evidence from Ireland. Dublin: Economic and Social Review.
- Florida Office of Insurance Regulation (2024) OIR Issues Update on Florida’s Property Insurance Market. Tallahassee: FLOIR, 3 April. Available at: https://floir.gov/home/2024/04/03/oir-issues-update-on-floridas-property-insurance-market [Accessed 1 June 2026]. [Citizens 2022 net loss: $2.2b; 2023 net income: $746m; combined ratio 204.4% to 59.5%; 13 companies assumed 354,000+ policies from Citizens.]
- NASA (2026) NASA Analysis Shows La Niña Limited Sea Level Rise in 2025. Washington DC: NASA. Available at: https://www.nasa.gov/earth/nasa-analysis-shows-la-nina-limited-sea-level-rise-in-2025/ [Accessed 1 June 2026].
- NASA JPL (2024) NASA Analysis Shows Irreversible Sea Level Rise for Pacific Islands. Pasadena: NASA JPL. Available at: https://www.jpl.nasa.gov/news/nasa-analysis-shows-irreversible-sea-level-rise-for-pacific-islands/ [Accessed 1 June 2026]. [At least 15 cm of sea level rise projected for Pacific Island nations over the next 30 years regardless of near-term emissions changes.]
- NASA JPL (2025) NASA Analysis Shows Unexpected Amount of Sea Level Rise in 2024. Pasadena: NASA JPL, 12 March. Available at: https://www.jpl.nasa.gov/news/nasa-analysis-shows-unexpected-amount-of-sea-level-rise-in-2024/ [Accessed 1 June 2026]. [Trend rate: 2.1 mm/yr (1993) to 4.5 mm/yr (2023); 2024 anomalous annual spike: 5.9 mm/yr vs expected 4.3 mm/yr; total rise since 1993: approx. 10 cm; two-thirds of 2024 rise from thermal expansion.]
- OECD (n.d.) Responding to Rising Seas: OECD Country Approaches to Tackling Coastal Risks. Paris: OECD.
- Review of Financial Studies (2023) Sea-Level Rise Exposure and Municipal Bond Yields. Oxford: Oxford University Press.
- ScienceDirect (2025) Sovereign ratings and physical climate risks. Journal of International Financial Markets, Institutions and Money.
- UNEP (2024) Adaptation Gap Report 2024: Come Hell and High Water. Nairobi: United Nations Environment Programme. Available at: https://www.unep.org/resources/adaptation-gap-report-2024 [Accessed 1 June 2026]. [International public adaptation finance to developing countries: $28b (2022); annual finance gap: $187 to $359b; doubling current flows closes approximately 5% of the gap.]
- Van Tricht, L. et al. (2026) Record-breaking glacier mass loss in Central Asia in 2025. Environmental Research Letters. DOI: 10.1088/1748-9326/ae6712. [Peer-reviewed. Field observations from 16 glaciers across Tien Shan and Pamir combined with regional modelling. Total loss: 30 km3; 9 of 16 glaciers worst year on record; 64% of all Central Asian glaciers worst year since 1991; western Pamir and Tien Shan lost 2 to 4% of ice volume in one year.]