
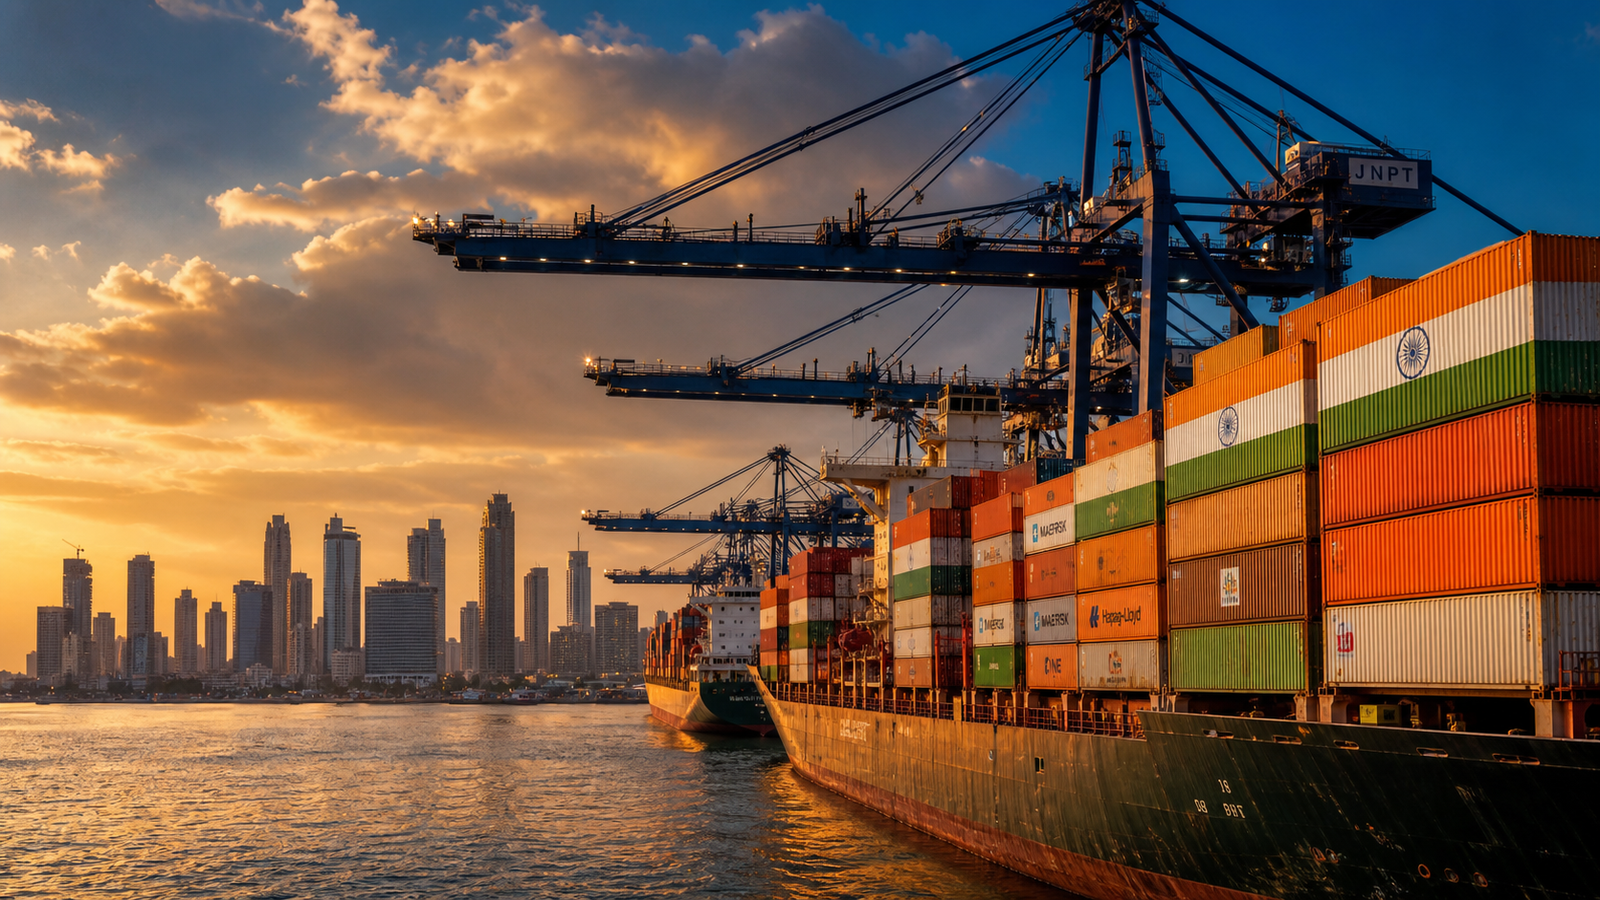
TL;DR: India’s merchandise exports grew 16% in April-May 2026, and four major corporates posted solid FY26 results: Reliance Industries, Tata Motors CV, Bajaj Finance, and Nykaa. These numbers are real, but three qualifications matter. First, a large share of export growth runs through petroleum refining at Jamnagar and through trade-diversion gains in Sri Lanka and Singapore that may not survive global normalisation. Second, MSME credit is under stress, which leaves the firms most exposed to supply chain shocks with the thinnest financial buffer. Third, the rupee sits near record lows, RBI data shows forex reserves fell to USD 671.63 billion as of June 12, and the Strait of Hormuz risk remains active. India enters FY 2026-27 with genuine momentum and a meaningful buffer against moderate shocks, but the data does not support a claim of structural resilience capable of absorbing a severe compound event.
I. Macro Trade Performance: Reading the Numbers Honestly
India’s merchandise trade opened FY 2026-27 on a strong note. The Ministry of Commerce and Industry reports that cumulative merchandise exports for April-May 2026-27 reached USD 88.91 billion, up 16.09% from USD 76.59 billion in the same period last year (Ministry of Commerce and Industry, 2026b, PIB Release ID 2273044, p. 1). Total exports including services reached USD 162.69 billion, a 14.66% year-on-year gain (Ministry of Commerce and Industry, 2026b, p. 1). These are the fastest two-month export growth rates India has recorded since the post-pandemic rebound of 2021-22.
The aggregate number, however, conceals an important compositional story. Table 1 shows the full bilateral trade picture, including the widening merchandise deficit and the services export line that most merchandise-focused commentary omits entirely.
Table 1: India Trade Performance, April-May 2026-27 vs. April-May 2025-26
| Indicator | Apr-May 2025-26 | Apr-May 2026-27 | YoY Change |
| Merchandise Exports (USD bn) | 76.59 | 88.91 | +16.09% |
| Merchandise Imports (USD bn) | 126.24 | 145.35 | +15.14% |
| Merchandise Trade Deficit (USD bn) | 49.65 | 56.44 | +13.68% |
| Services Exports (USD bn) | 65.30 | 73.79 | +13.00% |
| Total Exports incl. Services (USD bn) | 141.89 | 162.69 | +14.66% |
| Petroleum Products Exports (May, USD bn) | N/A* | 8.42 | +54.89% |
| Electronics Exports (April, USD bn) | 3.69 | 5.18 | +40.38% |
| Engineering Goods Exports (May, USD bn) | N/A* | 12.31 | +24.48% |
| Drugs & Pharmaceuticals Exports (May) | N/A* | +6.13% YoY | Positive growth |
| Non-Petro Non-G&J Exports (USD bn) | 59.15 | 65.89 | +10.49% |
Sources: Ministry of Commerce and Industry (2026a), PIB Release ID 2261383; Ministry of Commerce and Industry (2026b), PIB Release ID 2273044; Office of Economic Complexity (2026). *Prior-year monthly breakdown not separately published for these sub-categories. All figures provisional.
Before examining the merchandise figures in detail, the services line in Table 1 deserves explicit attention. Services exports reached USD 73.79 billion for April-May 2026-27, up 13% year-on-year from USD 65.30 billion (Ministry of Commerce and Industry, 2026b, p. 1). IT services drive this number: NASSCOM’s Annual Strategic Review 2026 records India’s tech exports at USD 246 billion for FY26, up 5.6% year-on-year from USD 233 billion in FY25 (NASSCOM, 2026), and India’s total services exports for FY26 reached a record USD 421.32 billion, growing 8.71% (BW Businessworld, 2026). Services are now India’s most structurally durable export category, and any resilience assessment that focuses only on merchandise misses the sector that does the heaviest lifting.
Turning to merchandise, the deficit widened to USD 56.44 billion from USD 49.65 billion, and the composition of that widening matters (Ministry of Commerce and Industry, 2026b, p. 1). Petroleum crude remains the dominant import driver (Ministry of Commerce and Industry, 2026b, p. 2), while petroleum products exports rose 54.89% to USD 8.42 billion in May 2026. This apparent paradox resolves when one considers India’s role as a refining entrepot, particularly through the Jamnagar complex. The refinery imports crude, processes it, and re-exports the product. That cycle inflates both sides of the trade ledger without reflecting broad industrial deepening.
The more encouraging signals come from non-commodity categories. Electronics exports rose 40.38% to USD 5.18 billion in April 2026 from USD 3.69 billion (Office of Economic Complexity, 2026), consistent with the ongoing scale-up of smartphone and component manufacturing under production-linked incentive schemes. Engineering goods exports rose 24.48% to USD 12.31 billion in May 2026 (Ministry of Commerce and Industry, 2026b, p. 2). Pharmaceuticals also grew 6.13% in May 2026 (Ministry of Commerce and Industry, 2026b, p. 2), building on FY25 pharma export volumes of USD 30.5 billion (Economic Survey 2025-26, cited in IBEF, 2026), which rank India as the third-largest pharmaceutical producer by volume globally.
The single most useful metric in Table 1 is the non-petroleum, non-gems-and-jewellery export figure. At USD 65.89 billion for April-May, up from USD 59.15 billion last year (Ministry of Commerce and Industry, 2026b, p. 3), this 10.49% rise strips out both commodity price effects and gold volatility. It gives the cleanest available picture of underlying manufacturing momentum, and it is the number analysts should weight most heavily.
One important caveat carries through every positive number in this section. A share of India’s export market gains reflects global trade disruption rather than durable competitiveness. For April-May combined, Sri Lanka rose 183.32%, Singapore rose 123.75%, and Tanzania rose 172.22% as import sources from India (Ministry of Commerce and Industry, 2026b, p. 1). These are not evidence of India winning new markets on price and quality. They reflect the China Plus One sourcing shift and regional reorientation driven by geopolitical disruptions. Note: the April 2026 month-specific figures used in earlier versions of this analysis (Sri Lanka +214%, Singapore +179%, Bangladesh +64%) differ from the April-May 2026-27 cumulative figures used here (Sri Lanka +183.32%, Singapore +123.75%, Tanzania +172.22%) because the Ministry of Commerce and Industry revised its April baseline data and the cumulative two-month figure naturally smooths single-month spikes; both sourced from PIB releases 2261383 and 2273044 respectively. When global trade flows normalise, some portion of these gains will reverse. The trade data alone cannot separate durable competitiveness gains from cyclical diversion, and that limitation matters for any resilience conclusion.
II. Corporate Evidence: An Expanded Sectoral Sample
Trade statistics capture what crosses borders, but they say little about the corporate foundations that sustain those flows. This section examines four companies that together span India’s most export-relevant sectors: Reliance Industries in petrochemicals and refining, Tata Motors Commercial Vehicles in capital goods, Bajaj Finance as a proxy for credit availability, and Nykaa as a signal of urban domestic demand. Table 2 summarises their key FY26 metrics before each is examined in turn.
Table 2: Selected Corporate Indicators, FY26
| Company | Key FY26 Metric | Value | YoY Change |
| Reliance Industries | Total Exports (FY26) | INR 2,78,808 cr | 6.7% of India merch. exports |
| Reliance Industries | Consolidated Revenue (FY26) | INR 11,75,919 cr | +9.8% |
| Reliance Industries | Net Profit (FY26) | INR 95,754 cr | +17.8% |
| Tata Motors CV | Full-year Export Volumes (FY26) | 428K units total | +54% YoY |
| Tata Motors CV | Standalone Revenue (FY26) | INR 77,400 cr | +11% |
| Bajaj Finance | Consolidated AUM (Mar 2026) | INR 5,09,975 cr | +22% |
| Bajaj Finance | Consolidated PAT (Q4 FY26)* | INR 5,553 cr | +22.2% |
| Bajaj Finance | Net Interest Margin (NIM) | 9.6% | Compressed from 9.7% |
| Nykaa (FSN E-Commerce) | Net Profit (Q4 FY26) | INR 79 cr | +316% |
| Nykaa (FSN E-Commerce) | Revenue from Operations (Q4) | INR 2,648 cr | +28.4% |
*Note on Bajaj Finance PAT: three sources report different consolidated Q4 FY26 PAT figures. Business Standard (2026a) reports INR 5,660 crore; BusinessToday (2026) reports INR 5,553 crore; PL Capital Research (2026) reports INR 5,465 crore. The variation reflects differences in treatment of one-time items including an ECL provision of INR 147 crore and exceptional gains from the BHFL stake sale. This analysis uses the BusinessToday figure of INR 5,553 crore as the base consolidated PAT, consistent with the company’s stock exchange filing. Standalone PAT of INR 4,840 crore (+23% YoY) is uncontested across all sources.
Sources: Reliance Industries AGM, June 19, 2026; Tata Motors Q4 FY26 filings, May 2026; Business Standard (2026a, 2026b); PL Capital Research (2026); Business Standard (2026c, 2026d).
II.A Reliance Industries: The Export Anchor
No other Indian company carries more weight in the export data than Reliance Industries. Its FY26 exports stood at INR 2,78,808 crore, which represents 6.7% of India’s total merchandise exports (ANI, 2026; Reliance Industries AGM, 2026). Consolidated revenue rose 9.8% to INR 11,75,919 crore, and net profit grew 17.8% to INR 95,754 crore (Open Magazine, 2026). EBITDA reached INR 2,07,911 crore, doubling from INR 97,580 crore in FY21 (ANI, 2026).
Two structural signals stand out. Retail and digital businesses now contribute nearly half of Reliance’s EBITDA (ANI, 2026), marking a shift away from the oil-to-chemicals base that has historically dominated the company’s earnings. This diversification reduces how much of Reliance’s export performance depends on crude oil prices staying within a favourable range. Looking further ahead, Reliance’s Co-Chairman has outlined an export target of USD 125-150 billion by 2032 (Scanx Trade, 2026). If the company delivers on even half that ambition, it would structurally reshape India’s export mix.
The counterweight sits in the petrochemicals segment. Reliance’s FY26 petrochemicals EBIT fell 10.1% due to lower KG D6 production and softer gas prices (Open Magazine, 2026). The segment that currently drives the largest share of Reliance’s export revenue sits under margin pressure. This brings the analysis back to the same concern raised in Section I: petroleum-related exports inflate India’s headline numbers, but the margin quality of those exports is weakening.
II.B Tata Motors Commercial Vehicles: Manufacturing Export Momentum
Where Reliance’s export story runs through refining, Tata Motors Commercial Vehicles offers a cleaner read on manufacturing competitiveness. The company grew its CV export volumes 54% year-on-year in FY26 and secured its largest-ever international order: 70,000 Yodha and Ultra T.7 vehicles for deployment in Indonesia (Dailyhunt, 2026; Manufacturing Today India, 2026; Scanx Trade, 2026b). This is concrete evidence of Indian capital goods breaking into Southeast Asian markets through competitive tendering rather than trade disruption diversion.
The financial profile of this growth is also sound. Standalone revenue reached INR 77,400 crore, up 11% year-on-year, with EBITDA margin improving 120 basis points to 13.2% (Manufacturing Today India, 2026). Free cash flow for the year grew to INR 9,200 crore (Manufacturing Today India, 2026), confirming the earnings quality. Volume growth funded by balance sheet stress would tell a different story; this growth generates cash.
Tata Motors also provides this analysis with its most instructive stress test. The JLR division saw FY26 revenue fall 20.9% to GBP 22.9 billion, with EBITDA margin dropping 760 basis points (Tata Motors Passenger Vehicles, 2026). Three forces drove that outcome: US tariffs on UK-produced vehicles, a slowdown in China’s luxury market, and a cyber incident that disrupted production. None of these events were unforeseeable in isolation, yet their coincidence compressed a world-class manufacturer’s profitability within a single fiscal year. JLR’s experience is the clearest available illustration of how compound external shocks can overwhelm strong underlying fundamentals, which is precisely the scenario a resilience framework needs to stress-test.
II.C Bajaj Finance: Credit Architecture and Its Limits
Credit availability is the connective tissue between trade momentum and corporate delivery. When working capital dries up, export orders go unfulfilled regardless of demand. Bajaj Finance’s Q4 FY26 results show that credit availability for India’s larger enterprises remains healthy. On a consolidated basis, AUM crossed the INR 5 lakh crore milestone, reaching INR 5,09,975 crore with 22% year-on-year growth (BusinessToday, 2026). Consolidated PAT grew 22.2% to INR 5,553 crore, and net interest income rose 20% to INR 11,781 crore (Business Standard, 2026a).
Table 3: Bajaj Finance Selected Financial Metrics, Q4 FY25 vs. Q4 FY26 (Consolidated)
| Metric | Q4 FY25 | Q4 FY26 | Change |
| Consolidated AUM (INR crore) | 4,16,661 | 5,09,975 | +22% |
| Consolidated PAT (INR crore)* | 4,546 | 5,553 | +22.2% |
| Standalone PAT (INR crore) | 3,940 | 4,840 | +23% |
| Net Interest Income (INR crore) | 9,808 | 11,781 | +20% |
| Cost of Funds | ~7.45% | 7.41% | Marginal improvement |
| Net Interest Margin (NIM) | ~10.2% | 9.6% | Modest compression |
| Gross NPA Ratio | 1.18% | 1.01% | Slight deterioration |
| MSME AUM Growth (FY26) | N/A | 6% | Deliberately slowed |
| Capital Adequacy Ratio | N/A | 21.55% | Well above RBI floor |
*PAT source reconciliation: Business Standard (2026a) reports INR 5,660 crore; BusinessToday (2026) reports INR 5,553 crore; PL Capital Research (2026) reports INR 5,465 crore. The differences reflect treatment of a one-time ECL provision (INR 147 crore) and an exceptional gain from the BHFL stake sale. This analysis uses INR 5,553 crore as the base consolidated figure, consistent with BSE/NSE exchange filings. Standalone PAT of INR 4,840 crore is undisputed.
Sources: Business Standard (2026a); BusinessToday (2026); PL Capital Research (2026). BSE/NSE filings, April 29, 2026.
Two numbers in Table 3 carry more analytical weight than the headline AUM figure. First, the cost of funds at 7.41% is sometimes misread as Bajaj Finance’s net interest margin (PL Capital Research, 2026). The actual NIM for Q4 FY26 was 9.6%, compressing from 9.7% the prior quarter, and management guided for further compression in FY27 as bond yields harden (PL Capital Research, 2026). A narrowing NIM limits how aggressively lenders can price new credit without taking on additional risk, and that constraint will tighten over FY27.
Second, and more important for trade resilience, is the MSME lending figure. Bajaj Finance deliberately slowed MSME AUM growth to just 6% in FY26 due to elevated delinquencies in that segment (PL Capital Research, 2026). MSMEs account for approximately 45% of India’s exports by value. These are precisely the firms most exposed to global freight timelines, input cost volatility, and working capital squeezes. A credit environment that works well for large enterprises but contracts for smaller ones is not a uniformly resilient one, and any resilience assessment that cites only the aggregate credit picture overstates the true position.
II.D Nykaa: Consumer Demand Signal and Its Scope
Sustained domestic demand matters for trade resilience because it keeps India’s manufacturing base occupied even when export orders soften. Nykaa’s FY26 results offer one signal on that front. The company reported Q4 FY26 consolidated net profit of INR 79 crore against INR 19 crore in Q4 FY25, a 316% rise (Business Standard, 2026c). Revenue from operations grew 28.4% to INR 2,648 crore and overall GMV grew 28% year-on-year (Business Standard, 2026c). At its Annual Investor Day on June 18, 2026, Nykaa outlined a roadmap targeting more than USD 5 billion in GMV by FY30 (FSN E-Commerce Ventures, 2026; Business Standard, 2026d), roughly 2.5 to 3 times its current scale.
This trajectory aligns with the IMF’s view that robust internal demand serves as the primary growth anchor for South Asian economies (International Monetary Fund, 2026, p. 34). Nykaa’s profitability shows that urban discretionary spending is healthy and growing, which supports the domestic demand argument at the micro level.
The scope limitation is important and this analysis acknowledges it directly. Nykaa’s 55 million customers (FSN E-Commerce Ventures, 2026) are urban, digitally active, and predominantly upper-middle-class. Rural demand responds to entirely different variables: monsoon performance, agricultural income, and fuel price pass-through. None of those variables appear in this dataset, and their absence is a genuine gap. FMCG volume trends, two-wheeler sales data, and kisan credit offtake figures would give a materially more complete picture of whether domestic demand holds up across income groups when external conditions tighten.
III. External Risk Factors: What Could Unwind the Gains
The corporate and trade data in Sections I and II point in a broadly positive direction. Before drawing conclusions from that data, this analysis needs to account for the external conditions that could rapidly reverse those gains. Table 4 maps the six most significant risk channels active as of June 2026, now sourced directly from RBI weekly data rather than aggregator estimates.
Table 4: Key External Risk Factors, June 2026
| Risk Factor | Current Status (June 2026) | Channel of Impact on Trade |
| Rupee Exchange Rate | ~INR 94/USD; near record lows | Raises import costs; squeezes exporter margins |
| Forex Reserves (RBI data) | USD 671.63 bn (week ending June 12) | Declined from USD 728 bn all-time high |
| Crude Oil Price | Brent elevated; Strait of Hormuz risk active | Widens import bill; feeds domestic inflation |
| FPI Capital Outflows | INR 2,00,000 cr (~USD 23-24 bn) net equity outflows in 2026 to May (NSDL/SEBI) | Adds rupee selling pressure; tightens liquidity |
| US Tariff Volatility | Post-Liberation Day uncertainty persists | Reduces demand for Indian manufacturing exports |
| China-Plus-One Diversion | Sri Lanka +183%, Singapore +124% (Apr-May 2026) | Gains partly cyclical; may not survive normalisation |
Sources: Reserve Bank of India Weekly Statistical Supplement (week ending June 12, 2026); Chartforest.com sourced from RBI; Finnovate (2026); Garg (2026); Ministry of Commerce and Industry (2026b).
III.A A Weakening Rupee and the Import Cost Spiral
The rupee hit record lows near INR 93.74-93.98 per dollar in March 2026 (Finnovate, 2026), pushed there by three concurrent forces: elevated crude oil prices, sustained FPI outflows that NSDL and SEBI data put at over INR 2,00,000 crore (approximately USD 23-24 billion) in net equity withdrawals through May 2026, described by JM Financial as the worst yearly tally since FPIs were first permitted in Indian equities in 1993 (NSDL/SEBI data; JM Financial via Multibagg, 2026), and geopolitical risk premium from the West Asian conflict. By mid-June 2026, the RBI reference rate had stabilised near INR 94 per dollar (Ziromarket, 2026), still close to historic lows.
A persistently weak rupee feeds directly into the trade dynamics already visible in Section I. It makes the import bill more expensive in rupee terms, which is particularly consequential for crude oil, where India covers over 85% of its requirements through imports (Finnovate, 2026). Higher import costs feed into domestic inflation, which puts upward pressure on bond yields, which in turn squeezes lender margins, exactly the compression dynamic Bajaj Finance flagged in its FY27 guidance. Former Finance Secretary Subhash Chandra Garg has assessed that the rupee’s decline toward INR 100 per dollar appears almost inevitable in 2026 without decisive policy intervention (Garg, 2026). If that assessment proves correct, the trade deficit will widen further and domestic financial conditions will tighten simultaneously.
III.B Forex Reserves: The RBI Data Shows a Declining Trajectory
RBI’s own Weekly Statistical Supplement shows India’s forex reserves at USD 671.63 billion for the week ending June 12, 2026 (Reserve Bank of India, Weekly Statistical Supplement, June 2026; Trading Economics, 2026). This compares with an all-time high of approximately USD 728 billion recorded earlier in the fiscal year (Ziromarket, 2026). The week-ending June 12 figure reflects a USD 9.985 billion decline in that single week, driven primarily by a USD 10.754 billion fall in gold reserve valuations (Chartforest, 2026).
At current levels, reserves cover approximately 11 months of goods imports, which remains comfortable by international standards (Reserve Bank of India, 2026, RBI Bulletin). The direction of travel matters more than the current level, however. Garg (2026) points out that the RBI’s reluctance to deploy reserves aggressively has itself contributed to an accelerated pace of rupee depreciation. A large reserve pile reassures investors, but only as long as the drawdown rate does not begin to signal an inability to manage the external account. Once that confidence erodes, the outflows the reserves exist to buffer can accelerate, and the cushion shrinks faster than the headline number suggests.
III.C Crude Oil and the Jamnagar Double Exposure
The Strait of Hormuz risk, made concrete by the 2026 West Asian conflict, represents the sharpest single external shock channel for India’s trade position. India imports over 85% of its crude oil (Finnovate, 2026), so a sustained Hormuz disruption would raise crude import costs, widen the trade and current account deficit, push the rupee lower, and lift domestic inflation, all at the same time.
Jamnagar adds a second exposure on top of the first. The refinery needs crude inputs to function, and those inputs become more expensive under a Hormuz disruption. Simultaneously, the petroleum product export margins that currently inflate India’s headline export growth would compress as global refining margins tighten. The 54.89% rise in petroleum product exports that looks encouraging in Table 1 (Ministry of Commerce and Industry, 2026b, p. 2) sits on top of exactly the geopolitical fault line most likely to crack under stress. That is a structural exposure worth naming clearly.
IV. Synthesis: What the Evidence Supports and What It Does Not
The three preceding sections point in different directions, and the synthesis task is to weigh them honestly rather than selectively.
The trade data makes the strongest positive case. Merchandise exports at USD 88.91 billion for April-May (Ministry of Commerce and Industry, 2026b, p. 1) represent genuine growth, and the non-petroleum core of USD 65.89 billion (Ministry of Commerce and Industry, 2026b, p. 3) confirms that the expansion runs wider than one commodity. Electronics up 40%, engineering goods up 24%, and pharmaceuticals growing at 6.13% in May all align with trends that predate the current fiscal year and reflect policy-backed structural change. Adding services exports of USD 73.79 billion for April-May (Ministry of Commerce and Industry, 2026b, p. 1) produces a total export picture that is considerably more robust than the merchandise headline alone suggests.
The corporate sample reinforces the positive reading in specific ways. Reliance Industries accounts for 6.7% of India’s merchandise exports (ANI, 2026) and delivered record revenue and profit despite a challenging global environment. Tata Motors CV produced 54% export volume growth and secured its largest-ever international order (Manufacturing Today India, 2026), evidencing genuine capital goods competitiveness. Bajaj Finance’s AUM growth of 22% and capital adequacy at 21.55% signal that large enterprise credit remains available (Business Standard, 2026a). Nykaa’s profitability aligns with the IMF’s view that strong domestic demand anchors South Asian economies (International Monetary Fund, 2026, p. 34).
Four structural vulnerabilities qualify all of that. The widening merchandise trade deficit signals that export growth is not yet outpacing import dependency. MSME credit stress, documented through Bajaj Finance’s deliberate lending slowdown, means the firms most exposed to trade volatility carry the thinnest buffers. A meaningful share of export market gains traces back to China Plus One trade diversion in Sri Lanka, Singapore, and Tanzania, which will partially unwind as global supply chains restabilise. And the currency and reserve dynamics of early to mid 2026, with the rupee near record lows and RBI reserves declining from their all-time high, represent a macro vulnerability that could amplify any of the above under stress.
Two scope gaps in this analysis also need acknowledging in the synthesis rather than only in individual sections. First, the corporate sample excludes pharma and IT services companies despite those sectors being India’s third-largest merchandise export category and largest services export category respectively. Including a firm like Sun Pharma or Infosys would test whether the positive credit and demand signals hold across a broader corporate base. Second, the domestic demand picture relies on Nykaa as a single urban digital platform. Rural demand indicators, which FMCG volume trends and two-wheeler sales figures would provide, are missing entirely. Any conclusion about domestic demand resilience that rests only on urban e-commerce profitability is incomplete.
JLR’s FY26 experience (Tata Motors Passenger Vehicles, 2026) offers the most useful frame for understanding what compound stress looks like. A company with genuine world-class competitive strengths saw revenue fall 20.9% in one year because three separately manageable risks coincided. India’s trade position faces an analogous set: an oil shock through Hormuz, sustained rupee depreciation, and MSME credit contraction could interact in the same way. No one of them alone would be decisive; together, they could be.
The defensible conclusion is that India enters FY 2026-27 with a meaningfully stronger trade posture than in recent years, supported by real manufacturing diversification, a healthy services export base, and a domestic financial system capable of absorbing moderate external headwinds. The data does not support a claim of structural resilience against severe compound shocks. Reaching that stronger conclusion would require evidence of healthy MSME credit, a narrowing current account trajectory, rural demand data, and export market gains that hold up after global trade normalises. None of those conditions appear in the current dataset.
References
ANI, 2026. Reliance posts record revenue, EBITDA and profit in FY26 despite global tensions. ANI News, June 19, 2026. Available at: aninews.in.
JM Financial / Multibagg, 2026. FPI Outflows Cross Rs2 Lakh Crore in 2026. Multibagg.ai, May 22, 2026. Data sourced from NSDL/SEBI FPI Investment Statistics.
Business Standard, 2026a. Bajaj Finance Q4 FY26: AUM crosses Rs5 lakh crore, PAT grows 27% to Rs5,660 crore. April 29, 2026.
Business Standard, 2026b. Bajaj Finance Q4 FY26: Net profit rises 23% Y-o-Y to Rs4,840 crore. April 29, 2026.
Business Standard, 2026c. Nykaa unveils FY30 vision, stock jumps 7%, hits 4-yr high. June 18, 2026.
Business Standard, 2026d. Nykaa spurts on outlining FY30 growth plan; targets over $5 billion GMV. June 18, 2026.
BusinessToday, 2026. Bajaj Finance Q4 FY26 results: PAT climbs 22% to Rs5,553 crore; declares Rs6 dividend. April 29, 2026.
BW Businessworld, 2026. India’s Total Exports Hit Record USD 863 Bn In FY26, Services Surge 8.71%. May 7, 2026.
Chartforest, 2026. Foreign Exchange Reserves of India. RBI-sourced weekly data. Available at: chartforest.com.
Dailyhunt, 2026. Tata Motors Q4 Results: Net profit grows 70%, revenue jumps to Rs24,452 crore. May 2026.
Economic Survey 2025-26, cited in IBEF, 2026. Indian Pharmaceuticals Industry Analysis. Government of India / India Brand Equity Foundation.
Finnovate, 2026. Indian Rupee Fall 2026: Why the Sharp Drop Is Now a Policy Story. Finnovate.in, March 24, 2026.
FSN E-Commerce Ventures Ltd. (Nykaa), 2026. Annual Investor Day 2026: FY30 Strategic Roadmap. Mumbai: Nykaa Investor Relations, June 18, 2026.
Garg, S.C., 2026. The Rupee Nears Rs100 to a Dollar. Why India’s Huge Forex Reserves May Not Be Enough to Stop its Decline. The Quint, May 19, 2026.
International Monetary Fund, 2026. World Economic Outlook: Navigating Divergent Growth Paths. Washington D.C.: IMF Publication Services, p. 34.
Manufacturing Today India, 2026. Tata Motors reports strong Q4 and FY26 financial results. May 15, 2026. Available at: manufacturingtodayindia.com.
Ministry of Commerce and Industry, Government of India, 2026a. Quick Estimates of India’s Foreign Trade, April 2026. New Delhi: Press Information Bureau, May 15, 2026. PIB Release ID: 2261383.
Ministry of Commerce and Industry, Government of India, 2026b. India’s Merchandise and Services Trade Statistics, April-May 2026-27. New Delhi: Press Information Bureau, June 2026. PIB Release ID: 2273044.
Office of Economic Complexity (OEC), 2026. India Trade Profile, April 2026. Available at: oec.world/en/profile/country/ind [Accessed June 2026].
Open Magazine, 2026. Reliance Industries FY26 Results: Revenue Jumps 9.8% to Rs11.75 Lakh Crore. openthemagazine.com, May 2026.
PL Capital Research, 2026. Bajaj Finance Q4FY26: Net Profit Rises 22% to Rs5,465 Crore. PL India, May 6, 2026. Available at: plindia.com.
Reserve Bank of India, 2026. Macroeconomic Developments and Credit Intermediation Trends. RBI Bulletin, June 2026. Mumbai: Reserve Bank of India, pp. 12-15.
Reserve Bank of India, Weekly Statistical Supplement, June 2026. Week ending June 12, 2026. Available at: rbi.org.in.
Scanx Trade, 2026. Reliance Industries reports record FY26 revenue and profit. Scanx.trade, June 2026.
Scanx Trade, 2026b. Tata Motors Q4 FY26: Record Revenue, Margin Expansion, and Strong Cash Generation. Scanx.trade, May 2026.
Tata Motors Passenger Vehicles, 2026. TMPV Consolidated Q4 FY26 Results. Press Release, May 14, 2026. Available at: cars.tatamotors.com.
Trading Economics, 2026. India Foreign Exchange Reserves. Available at: tradingeconomics.com/india/foreign-exchange-reserves [Accessed June 2026].
NASSCOM, 2026. Annual Strategic Review 2026: India Tech Industry Revenue at $315 Billion, Exports at $246 Billion. National Association of Software and Services Companies, February 2026. Available at: nasscom.in.
Ziromarket, 2026. India Forex Reserves 2026: Your Rupee Shield. Ziromarket.com, June 2026.
Click here to read more such insightful articles.