
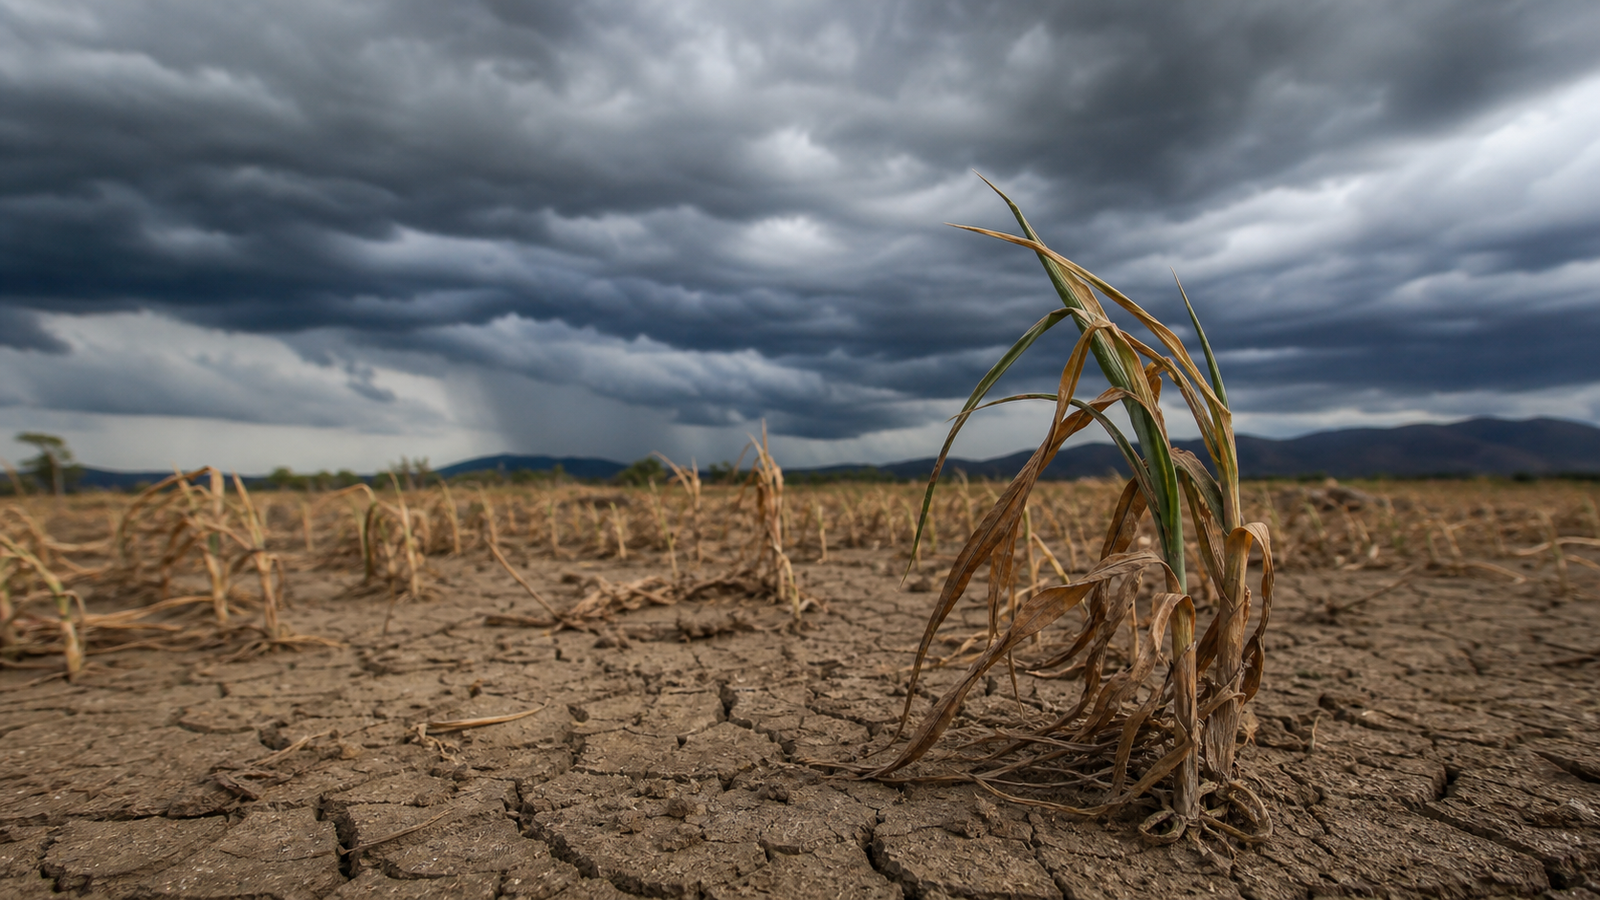
TL; DR: El Niño 2026 begins as a Pacific climate shift, but its real impact shows up in rainfall changes, crop stress, food inflation, and supply-chain disruption. The countries most exposed are those with weak food systems and limited buffers, so the event matters less as a global weather headline and more as a test of economic resilience in South Asia, Southern Africa, Central America, and similar vulnerable regions.
Introduction
El Niño deserves attention in 2026 because it begins in the Pacific and ends in places that look far removed from ocean temperature maps. A change in sea surface temperature can alter rainfall patterns, shift harvest timing, disturb transport routes, and lift food prices in economies that already have limited room for error (NOAA, 2009; NOAA, 2025; NOAA PSL, n.d.).
Forecasts from NOAA and the World Meteorological Organization indicate a strong likelihood that El Niño conditions will develop during 2026 and persist into the Northern Hemisphere winter of 2026 to 2027 (NOAA, 2026; WMO, 2026; UN News, 2026). The value of that forecast lies not in the headline itself, but in the warning it gives about a wider chain of economic effects.
The event therefore needs to be read in stages. First comes the oceanic shift. Then comes the atmospheric response. After that, rainfall patterns change, agriculture adjusts, and economic pressure begins to build across food markets, trade corridors, and household budgets (NOAA, 2009; NOAA PSL, n.d.; FAO, 2018).
How El Niño forms
Under normal conditions, strong trade winds push warm water westward across the equatorial Pacific while cooler water rises near South America through upwelling (NOAA, 2009; NOAA PSL, n.d.). During El Niño, those trade winds weaken. Warm water spreads eastward. Upwelling falls. Sea surface temperatures rise in the central and eastern Pacific, and the atmosphere above it adjusts accordingly (NOAA, 2009; NOAA PSL, n.d.).
That adjustment matters because tropical rainfall follows warm water. As the main zone of convection shifts, rainfall increases in some regions and declines in others (NOAA, 2009; NOAA PSL, n.d.; WHO, 2023). The process is physical, but its consequences are economic. Once rainfall shifts, agriculture, logistics, and food supply all begin to respond (FAO, 2018; FAO, 2026).
The most useful way to think about El Niño is as a climate mechanism with economic reach. It begins as an ocean-atmosphere interaction and ends as a change in market conditions, public finances, and living costs (NOAA, 2025; NOAA PSL, n.d.; IMF, 2016).
Why El Niño matters economically
Agriculture sits at the centre of the transmission process because crops depend directly on rainfall, temperature, and seasonality (FAO, 2018; FAO, 2026). A wetter season can flood fields, delay planting, or interrupt transport. A drier season can reduce yields, stress livestock, and weaken water supplies. Both outcomes reduce output or raise production costs, and both can feed into domestic price pressure (FAO, 2018; FAO, 2026).
Once food supply tightens, the effect travels outward. Wholesale markets react first. Retail prices adjust after that. Households respond by cutting discretionary spending. Firms see higher input costs. Governments then face pressure to import food, expand subsidies, or offer emergency relief (IMF, 2016; IMF, 2016b; World Bank, 2026).
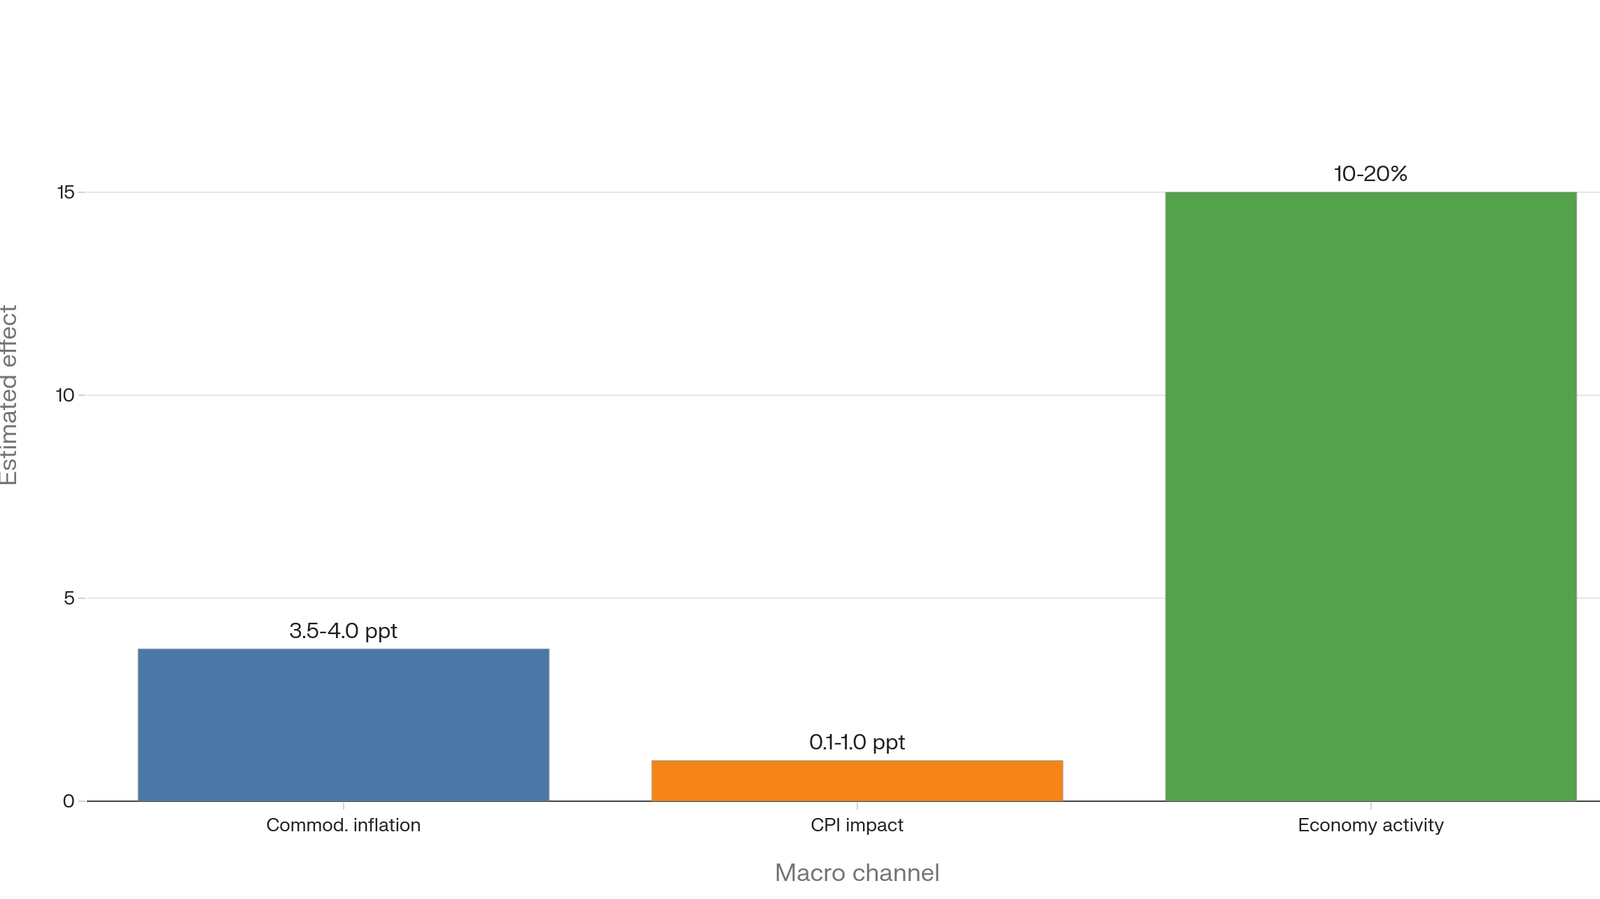
The IMF’s research gives the macroeconomic picture a more concrete form. It finds that a one-standard-deviation positive ENSO shock raises real commodity price inflation by about 3.5 to 4 percentage points and also influences consumer inflation and world economic activity (IMF, 2016; IMF, 2016b). That is large enough to matter in food-importing economies and in countries where households already spend a high share of income on essentials (IMF, 2016; World Bank, 2026).
This is why El Niño cannot be treated as a narrow climate story. It becomes an economic shock when weather disruption collides with fragile food systems, thin reserves, and limited policy space (FAO, 2026; IMF, 2016b; World Bank, 2026).
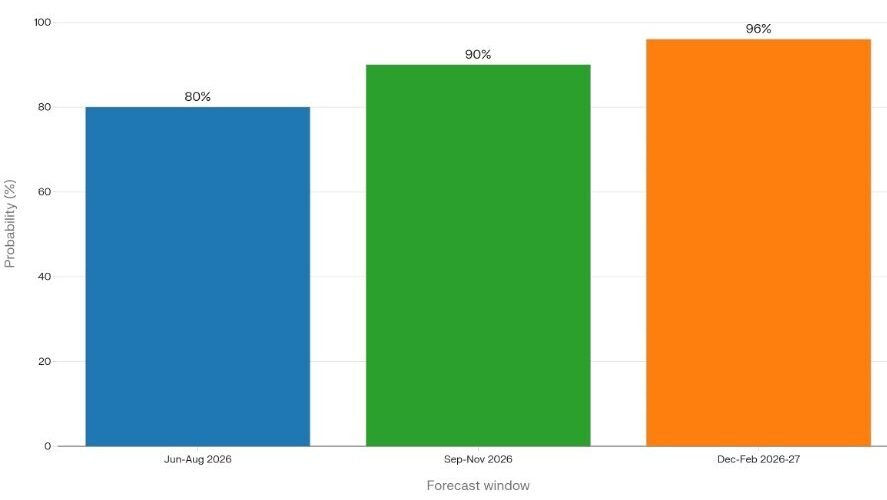
Figure 1 shows the current probability outlook for El Niño across the 2026 to 2027 forecast windows. It illustrates a pattern of rising confidence as the event is expected to develop and persist through winter (NOAA, 2026; WMO, 2026).
Regional exposure
The regions most exposed to El Niño are South Asia, Southern Africa, Central America, northern South America, the Caribbean, Australia, and Indonesia, with the Horn of Africa and parts of Central Asia also vulnerable to flood-related damage in some seasons (FAO, 2026; WMO, 2026; World Bank, 2026). These regions do not face identical risks, but they do share a common problem: rainfall disruption arrives in economies that often have little slack.
South Asia is especially significant because agriculture remains central to livelihoods and food prices carry major social weight (FAO, 2018; FAO, 2026). Southern Africa faces similar pressure, especially where harvests already run close to the edge and food insecurity remains a recurring concern (FAO, 2026; World Bank, 2026). Central America and northern South America face a different but equally serious problem, where dry conditions can weaken crops, cut rural incomes, and strain local food markets at the same time (FAO, 2026; World Bank, 2026).
Australia and Indonesia need a separate reading. In those economies, water stress, agricultural losses, and fire risk often dominate the immediate impact, while inflation effects travel more indirectly through exports, logistics, and supply conditions (WMO, 2026; NOAA, 2026). The Horn of Africa and Central Asia face flood risk that can damage roads, storage facilities, and local infrastructure, which makes recovery more difficult even when rainfall is welcome in other seasons (FAO, 2026; WMO, 2026).
Figure 2 summarises the historical macroeconomic channel. It explains why El Niño matters beyond agriculture, especially through commodity prices, consumer prices, and wider activity effects (IMF, 2016; IMF, 2016b).
How the El Niño 2026 Climate Shock Travels Into Global Inflation
The path from climate shift to economic damage is fairly well established. Warm ocean conditions alter rainfall. Rainfall changes affect crops. Crop losses push up food prices. Food prices then spill into broader inflation and household spending (IMF, 2016; FAO, 2018; World Bank, 2026). Flood-prone areas experience a related chain, where roads, ports, and storage systems are disrupted even when production remains partly intact (FAO, 2026; WMO, 2026).
This sequence matters because it explains why El Niño behaves differently across countries. Some economies can absorb the shock through grain stocks, transport resilience, or fiscal support. Others move quickly from weather stress to food insecurity and inflation pressure because they lack those buffers (FAO, 2026; IMF, 2016b; World Bank, 2026).
The trade channel is equally important. Weather shocks disrupt shipping schedules, inland transport, and supply reliability. Countries that depend on narrow corridors or imported food can experience a small external shock as a much larger domestic problem (WMO, 2026; NOAA, 2026; World Bank, 2026).
Critical reading
The point of analysis is not simply that El Niño affects weather. That much is settled. The real question is why the same climate event creates severe economic stress in some places and only mild pressure in others (NOAA, 2009; NOAA PSL, n.d.; IMF, 2016). The answer lies in vulnerability: food dependence, weak logistics, limited reserves, and low fiscal capacity all raise the scale of the damage (FAO, 2026; World Bank, 2026).
This is where the event becomes analytically useful. It reveals where systems are weakest. It shows where a climate shock can become a price shock, where a price shock can become a welfare shock, and where a welfare shock can become a political problem (IMF, 2016b; FAO, 2026). A serious reading of El Niño therefore has to be descriptive, analytical, and critical at the same time.
Conclusion
El Niño 2026 should be understood as a climate event with measurable economic consequences and clear regional asymmetries. The Pacific warming itself is only the beginning. Once the trade winds weaken and rainfall patterns shift, the impact moves through agriculture, food supply, transport, inflation, and finally household welfare (NOAA, 2009; NOAA PSL, n.d.; IMF, 2016). That chain explains why the same event can produce flood risk in one region, drought in another, and higher food prices elsewhere.
The regions most likely to feel the strongest pressure are South Asia, Southern Africa, Central America, northern South America, the Caribbean, Australia, Indonesia, the Horn of Africa, and parts of Central Asia (FAO, 2026; WMO, 2026; World Bank, 2026). The final outcome in each case will depend on harvest timing, food dependence, logistics, fiscal space, and the speed of policy response (IMF, 2016; IMF, 2016b; World Bank, 2026). The event is therefore not a simple weather update. It is a test of resilience, planning, and policy capacity.
The broader lesson is that weather becomes economically important when it meets vulnerability. El Niño matters because it exposes the places where resilience is thin and the margin for error is small (FAO, 2026; IMF, 2016b; World Bank, 2026). For households, the main risk is reduced purchasing power. For firms, it is supply-chain disruption and input cost pressure. For policymakers, it is the need to manage a shock that begins in the ocean but ends in the economy. That is the real significance of El Niño 2026.
References
FAO (2018) Understanding the drought impact of El Niño on the global food system. Food and Agriculture Organization of the United Nations. Available at: https://www.fao.org/in-action/naps/resources/detail/en/c/433896/ (Accessed: 2 June 2026).
FAO (2026) El Niño. Food and Agriculture Organization of the United Nations. Available at: https://www.fao.org/el-nino/en (Accessed: 2 June 2026).
IMF (2016) El Niño Good Boy or Bad? Finance & Development. International Monetary Fund. Available at: https://www.imf.org/external/pubs/ft/fandd/2016/03/cashin.htm (Accessed: 2 June 2026).
IMF (2016b) El Niño and World Primary Commodity Prices: Warm Water or Hot Air? International Monetary Fund. Available at: https://www.imf.org/en/publications/wp/issues/2016/12/30/el-nino-and-world-primary-commodity-prices-warm-water-or-hot-air-3910 (Accessed: 2 June 2026).
NOAA (2009) What are El Nino and La Nina? National Oceanic and Atmospheric Administration. Available at: https://oceanservice.noaa.gov/facts/ninonina.html (Accessed: 2 June 2026).
NOAA (2025) El Niño & La Niña (El Niño-Southern Oscillation). NOAA Climate.gov. Available at: https://www.climate.gov/enso (Accessed: 2 June 2026).
NOAA (2026) ENSO Diagnostic Discussion, 14 May. National Oceanic and Atmospheric Administration. Available at: https://www.cpc.ncep.noaa.gov/products/analysis_monitoring/enso_advisory/ensodisc.shtml (Accessed: 2 June 2026).
NOAA Physical Sciences Laboratory (n.d.) ENSO Background and Description. Available at: https://psl.noaa.gov/enso/enso.description.html (Accessed: 2 June 2026).
UN News (2026) El Niño confirmed, set to fuel more extreme weather, says WMO. United Nations. Available at: https://news.un.org/en/story/2026/06/1167620 (Accessed: 2 June 2026).
WMO (2026) Likelihood increases of El Niño, 21 April. World Meteorological Organization. Available at: https://wmo.int/media/news/wmo-likelihood-increases-of-el-nino (Accessed: 2 June 2026).
WHO (2023) El Niño Southern Oscillation (ENSO). World Health Organization. Available at: https://www.who.int/news-room/fact-sheets/detail/el-nino-southern-oscillation-(enso) (Accessed: 2 June 2026).
World Bank (2026) Food Security | Food Insecurity Statistics & Solutions. World Bank Group. Available at: https://www.worldbank.org/en/topic/agriculture/brief/food-security-update (Accessed: 2 June 2026).


Very informative article! The connection between El Niño and its impact on agriculture, food prices, and the global economy is explained really well. Looking forward to reading more such insights.