
TL;DR: The Housing Crisis in Brief
The US housing market faces a supply deficit of 4.03 million homes, pushing median prices 34.4% above 2019 levels and forcing one in three adults under 35 to live with a parent. The Senate’s bipartisan ROAD to Housing Act attempts to close the gap through zoning reform incentives, federal grants, and streamlined planning processes. While the legislation marks genuine policy progress on the affordability front, critics argue it does not go far enough to address the mortgage lock-in effect, the scale of the supply shortage, or the structural barriers that keep younger generations out of the market.
The Numbers Behind the Crisis
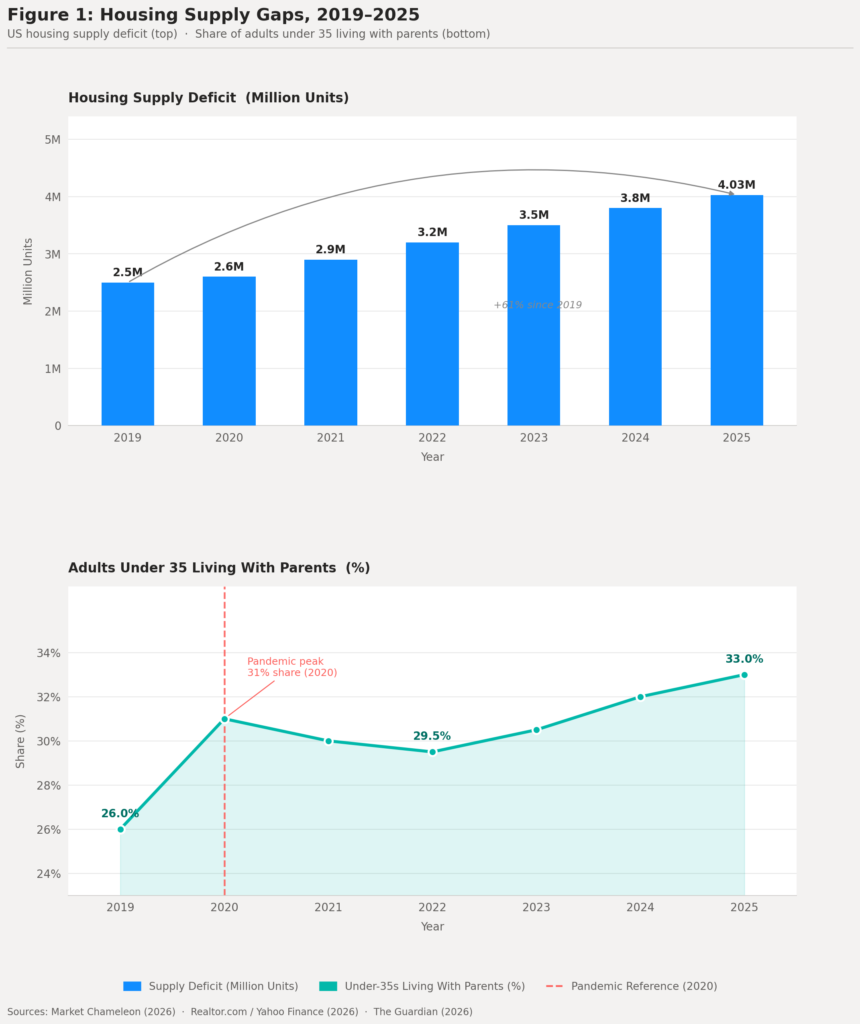
One statistic tells the story more clearly than most: in 2025, roughly one in three adults under the age of 35 in the United States was living with a parent, largely due to rising costs of accommodation.(The Guardian, 2026) That is approximately 25.2 million people, many of whom would, in a different economic environment, have already formed their own households. It is a figure worth pausing on, because it points to something much larger than a bad year in the property market. It signals a structural shift in how younger generations relate to the idea of owning a home.
Prices have risen 34.4% since 2019, and the US supply gap reached 4.03 million units in 2025, up from 3.8 million in 2024.(Market Chameleon, 2026)(Real Estate News, 2026) In 2025 alone, 1.41 million new households formed while only 1.36 million starts took place, adding a net deficit of roughly 50,000 homes to an already strained market.(Market Chameleon, 2026) These numbers compound year on year, and their weight falls hardest on younger buyers trying to enter the market for the first time.
Goldman Sachs Research estimates that resolving the shortage entirely would require building 3 to 4 million additional homes beyond the normal pace of construction, a scale of investment the country has not managed in decades.(Goldman Sachs, 2025)
Why Supply Fell So Far Behind
The shortage did not appear overnight. Several forces converged over roughly fifteen years to create the supply constraints and affordability pressures we see today.
The most immediate is the “lock-in effect.” About half of US mortgage holders are still paying rates below 4%, and around 80% are paying under 6%.(Chase, 2025) With rates sitting well above those levels today, many homeowners see little reason to sell and take on a higher monthly payment. The result is historically low inventory, which pushes buyers toward a shrinking pool of new builds.
Beneath that lies the legacy of underbuilding after the 2008 financial crisis. For several years following the crash, construction activity dropped sharply, and the sector never fully recovered the ground it lost.(Chase, 2025) Zoning laws, minimum lot sizes, and resistance to higher-density development have since made it difficult to build at the pace demand requires.(Tufts University, 2025)(Davis Vanguard, 2025) As Tufts University researchers noted, land-use restrictions and local planning rules remain among the most important structural factors limiting supply in the United States.(Tufts University, 2025)
The Affordability Squeeze on Young Adults
The economic consequences of the crisis for younger generations are significant, though the full picture of its long-term social impact is still developing. Freddie Mac research found that higher rents and home prices account for 49% of the decline in homeownership among young adults, with lower marriage rates (22%) and student debt constraints (13%) contributing further to delayed entry into the market.(Freddie Mac, n.d.) The Institute for Fiscal Studies found a comparable pattern across European markets, noting that virtually all of the fall in ownership among 25 to 34 year-olds between the mid-1990s and mid-2010s could be explained by rising prices relative to after-tax incomes.(Institute for Fiscal Studies, n.d.)
Realtor.com Senior Economic Research Analyst Hannah Jones has observed that many younger households have postponed forming entirely because of affordability pressures, choosing instead to stay with relatives, share accommodation, or live with roommates.(Yahoo Finance/Realtor.com, 2026) Approximately 1.82 million Gen Z and millennial households that would historically have been independent are now stuck in a prolonged period of delayed independence, according to Realtor.com data.(Yahoo Finance/Realtor.com, 2026) The market, in other words, is not just failing buyers. It is reshaping how a generation lives.
Figure 1: A Decade of Widening Supply Gaps
The ROAD to Housing Act: What It Promises
Against this backdrop, the Senate Banking Committee unanimously passed the Renewing Opportunity in the American Dream (ROAD) to Housing Act of 2025, sponsored by Senator Tim Scott (R-SC) and Senator Elizabeth Warren (D-MA). It is the first major bipartisan legislation on supply and affordability to reach committee level in over a decade.(Mayer Brown, 2025)(Politico, 2025)
Rather than a single targeted intervention, the bill takes a broad, incentive-led approach. Its core provisions include:
- Zoning and land-use frameworks (Section 203): HUD would develop guidance that state and local governments can draw on when reforming planning rules, with explicit recognition that recommendations cannot be one-size-fits-all across rural, suburban, and urban communities.(National League of Cities, 2026)(Fox Rothschild, 2025)
- Innovation Fund (Section 209): Federal grants of between $250,000 and $10 million would be available to communities that demonstrably increase their housing supply, offering financial incentives to jurisdictions willing to undertake regulatory reform.(Cato Institute, 2025)
- Pattern-book homes: Both the ROAD Act and the companion Housing for the 21st Century Act authorise federal grants for pre-approved home designs, which can significantly shorten permitting timelines for builders.(National League of Cities, 2026)
- Environmental review reforms (Sections 207 and 208): HUD funding recipients could conduct their own NEPA reviews, and new exceptions would apply to infill projects on parcels of five acres or less that have been previously disturbed.(Legal Planet, 2025)
- Community Development Block Grant incentives: Additional CDBG funding would flow to jurisdictions with higher population growth that have also reformed zoning to allow more supply.(Legal Planet, 2025)
The legislation also directs HUD to create a new grant and loan programme for homeowners and small landlords to address repairs and health hazards, and establishes a pilot scheme to incentivise residential development across participating jurisdictions.(Politico, 2025)
What the Bill Might Actually Change
The Case for Reform Optimism
Supporters of the bill argue that its real value lies in building the institutional conditions for supply growth, rather than trying to mandate production directly.(Reason Foundation, 2025) By avoiding preemption of local zoning authority and instead offering research, guidance, and financial incentives, the legislation stands a reasonable chance of gaining traction in communities that are open to change. Many of the reforms highlighted in the proposed federal policy guidelines, including reducing minimum lot sizes, parking reform, allowing accessory dwelling units (ADUs), and streamlining building codes, have solid evidence behind them at the state level.(Reason Foundation, 2025)
Several US states have already moved in this reform direction independently. California has passed a series of zoning laws in recent years, and Legal Planet analysts noted in 2025 that federal action could meaningfully complement and reinforce state-level progress.(Legal Planet, 2025)
Where the Bill May Fall Short
There are legitimate questions about whether the bill goes far enough to address the crisis and its underlying supply problem. The Cato Institute, writing in late 2025, argued that the ROAD Act largely continues the status quo in federal policy and does little to restructure the funding landscape, noting that the Innovation Fund language is broad enough that it may primarily redirect money to projects local governments were already planning.(Cato Institute, 2025)
Others raise a broader structural concern: at a deficit of 4 million homes, incremental zoning guidance may simply not be sufficient.(Goldman Sachs, 2025) The National League of Cities has identified supply and availability as near the top of urgent concerns facing local leaders, with 57% of survey respondents rating the situation as severe.(National League of Cities, 2026) Addressing that level of need requires considerably more than guidance documents. It demands changes to the economics of construction, including material costs, labour availability, and financing conditions, none of which the bill directly touches.
The mortgage lock-in effect is another area the legislation does not address. Even if new homes are built at a faster pace, the reluctance of existing owners to sell will continue to compress available inventory and dampen market activity in the near term.(Chase, 2025)
The Broader Social Impact of the Crisis
Affordability carries consequences that extend far beyond property values. Research published by NPR in 2025 found that some Americans are having fewer children than planned, partly because prices and space constraints make raising a family in their current accommodation genuinely difficult.(NPR, 2025) The European Central Bank, studying similar trends across Europe, found that earnings inequality and income uncertainty are key drivers of declining homeownership among younger cohorts, with many unwilling to take on a large, illiquid property investment against an uncertain income backdrop.(European Central Bank, 2022)
The Urban Institute has argued that the widening ownership gap between today’s young adults and earlier generations carries significant long-term wealth implications.(Urban Institute, 2023) Previous generations built meaningful wealth through property equity over decades, making homeownership a cornerstone of long-term financial stability. A generation priced out of the market for even five to ten years faces a compounding disadvantage that is genuinely difficult to recover from later in life.
Some younger adults are adapting in notably creative ways. Fortune reported in 2025 that nearly one in three Gen Zers said they would consider co-buying a home with friends or family to navigate costs, and that more than three in four first-time buyers in 2024 made their purchase with some form of partner.(Fortune, 2025) These are workarounds, not solutions, and they reflect how significantly the market has shifted from one designed around individual household formation and accessible ownership.
A Long Road Ahead for Housing Reform
The ROAD to Housing Act represents a meaningful step in a space where sustained federal action on supply and affordability has been largely absent for over a decade.(Mayer Brown, 2025) Its bipartisan passage through the Senate Banking Committee suggests that, at the level of policy diagnosis, there is growing agreement that supply is the central problem the country faces.
Whether the bill translates into homes that people can actually afford remains a harder question. The supply deficit at 4.03 million units is wide, starts are consistently outpaced by household formation, and many of the deeper structural barriers to building, including local political resistance to development, labour shortages, and rising construction costs, fall outside the bill’s scope. The legislation may prove most valuable as a foundation: building the evidence base, setting up incentive structures, and creating institutional frameworks that could enable more ambitious action down the line.
For the roughly 25 million young adults currently living with a parent, that housing reform timeline matters, and the window to act is not unlimited.(The Guardian, 2026) The market does not need to be perfect, and reform does not need to be all-encompassing to make a real difference. It simply needs to start moving in a direction that gives this generation a realistic path toward a home of their own.
References
Cato Institute (2025) ‘The ROAD to more federal control: how Congress is misdiagnosing America’s housing problems’, 4 December. Available at: https://www.cato.org/briefing-paper/road-more-federal-control-how-congress-misdiagnosing-americas-housing-problems (Accessed: 23 June 2026).
Chase (2025) ‘A shortage of supply: the housing market explained’, 16 October. Available at: https://www.chase.com/personal/investments/learning-and-insights/article/tmt-october-seventeen-twenty-five (Accessed: 23 June 2026).
Davis Vanguard (2025) ‘Opinion: the hidden crisis behind the housing market’s stalemate’, 23 June. Available at: https://davisvanguard.org/2025/06/affordability-crisis-in-us-housing-market/ (Accessed: 23 June 2026).
European Central Bank (2022) ‘Younger generations and the lost dream of homeownership’, 25 January. Available at: https://www.ecb.europa.eu/press/research-publications/resbull/2022/html/ecb.rb220126~4542d3cea0.en.html (Accessed: 23 June 2026).
Fortune (2025) ‘Gen Z can’t afford a house on their own, so they’re buying with friends’, 13 July. Available at: https://fortune.com/2025/07/14/gen-z-baby-boomers-communal-living-housing-market/ (Accessed: 23 June 2026).
Fox Rothschild (2025) ‘ROAD to Housing Act: shutdown has major affordable housing reforms in limbo’, 15 October. Available at: https://www.foxrothschild.com/publications/road-to-housing-act-shutdown-has-major-affordable-housing-reforms-in-limbo (Accessed: 23 June 2026).
Freddie Mac (n.d.) ‘Rising housing costs cited as root cause of lagging homeownership rate among young adults’. Available at: https://sf.freddiemac.com/docs/pdf/press-release/rising-housing-costs-cited-as-root-cause-of-lagging-homeownership-rate-among-young (Accessed: 23 June 2026).
Goldman Sachs (2025) ‘The outlook for US housing supply and affordability’, 20 October. Available at: https://www.goldmansachs.com/insights/articles/the-outlook-for-us-housing-supply-and-affordability (Accessed: 23 June 2026).
Institute for Fiscal Studies (n.d.) ‘Barriers to homeownership for young adults’. Available at: https://ifs.org.uk/sites/default/files/output_url_files/GB9-housing-pre-release-final.pdf (Accessed: 23 June 2026).
Legal Planet (2025) ‘The ROAD to housing?’, 14 September. Available at: https://legal-planet.org/2025/09/15/the-road-to-housing/ (Accessed: 23 June 2026).
Market Chameleon (2026) ‘U.S. housing supply gap surpasses 4 million homes’, 2 March. Available at: https://marketchameleon.com/articles/b/2026/3/3/us-housing-supply-gap-surpasses-4-million-homes (Accessed: 23 June 2026).
Mayer Brown (2025) ‘Bipartisan housing reform advances in the Senate’, 3 August. Available at: https://www.mayerbrown.com/en/insights/publications/2025/08/bipartisan-housing-reform-advances-in-the-senate (Accessed: 23 June 2026).
NPR (2025) ‘Housing prices are causing some people to have smaller families than planned’, 25 September. Available at: https://www.npr.org/2025/09/25/nx-s1-5540077/housing-prices-fewer-children (Accessed: 23 June 2026).
National League of Cities (2026) ‘What the Housing for the 21st Century and ROAD to Housing Acts mean for local governments’, 12 February. Available at: https://www.nlc.org/article/2026/02/13/what-the-housing-for-the-21st-century-and-road-to-housing-acts-mean-for-local-governments (Accessed: 23 June 2026).
Politico (2025) ‘Senate Banking advances first large, bipartisan housing package in a decade’, 29 July. Available at: https://www.politico.com/live-updates/2025/07/29/congress/senate-banking-advances-first-large-bipartisan-housing-package-in-a-decade (Accessed: 23 June 2026).
Real Estate News (2026) ‘Deeply rooted housing shortage worsened in 2025’, 2 March. Available at: https://www.realestatenews.com/2026/03/03/deeply-rooted-housing-shortage-worsened-in-2025 (Accessed: 23 June 2026).
Reason Foundation (2025) ‘The ROAD to Housing Act carries promise but risks bureaucratic expansion’, 2 December. Available at: https://reason.org/commentary/the-road-to-housing-act-carries-promise-but-risks-bureaucratic-expansion/ (Accessed: 23 June 2026).
The Guardian (2026) ‘Not so empty nesters: record-high number of US adults under 35 live at home, new data says’, 18 June. Available at: https://www.theguardian.com/society/2026/jun/18/us-adults-under-35-living-at-home (Accessed: 23 June 2026).
Tufts University (2025) ‘Why is the cost of owning a home so high now?’, 5 November. Available at: https://now.tufts.edu/2025/11/06/why-cost-owning-home-so-high-now (Accessed: 23 June 2026).
Urban Institute (2023) ‘The real homeownership gap between today’s young adults and past generations’, 16 April. Available at: https://www.urban.org/urban-wire/real-homeownership-gap-between-todays-young-adults-and-past-generations-much-larger-you (Accessed: 23 June 2026).
Yahoo Finance/Realtor.com (2026) ‘Why 1.8M Gen Z and millennials vanished from the housing market in 2025’, 15 March. Available at: https://finance.yahoo.com/news/why-1-8m-gen-z-230109688.html (Accessed: 23 June 2026).